How did the fare, age or gender affected the probability to survive on the Titanic? And how can we use this information to predict the probability to survive for each passenger? That´s the competition, which is offered by Kaggle to get into machine learning and data analytics. Kaggle is a platform, which offers competitions from companies/researchers to everyone, who is interested. And you can also win awards by solving these competitions as the best. The greatest fact is, that everyone can use the published dataset.
I´d like to share some techniques, how we can estimate if a passenger survives with Apache Spark. But first i will share some insights into the dataset, to get a rough overview, what data is given. These visualization is all created with Python and the Mathplotlib.
Overview
This series is about using Apache Spark for supervised learning and making predictions with the most relevant classifier types:
- Data Exploration: This post
- Naive Bayes
- SVM
- Random Forest
- ANN
The Data
In very large data sets there is often invalid, incomplete or just missing data. So the first thing to do is always look at the data, analyse the data and understand the data. This step is very important and can save you very much time. Pick some sample data and visualize some things.
| PassengerId | Survived | Pclass | Name | Sex | Age | SibSp | Parch | Ticket | Fare | Cabin | Embarked |
| 1 | 0 | 3 | Braund, Mr. Owen Harris | male | 22.0 | 1 | 0 | A/5 21171 | 72.500 | NaN | S |
| 2 | 1 | 1 | Cumings, Mrs. John Bradley (Florence Briggs Th… | female | 38.0 | 1 | 0 | PC 17599 | 712.833 | C85 | C |
Datatypes (the statistics view)
Quantitative
- nominal (countable)
- ordinal (countable, sortable)
Qualitative
- interval (countable, sortable, +/- , mean)
- ratio (countable, sortable, +/-, mean, zero point)
In the titanic data set there are these columns:
survival        Survival(nominal)
                (0 = No; 1 = Yes)
pclass          Passenger Class(ordinal)
                (1 = 1st; 2 = 2nd; 3 = 3rd)
name            Name (nominal)
sex             Sex (nominal)
age             Age (ratio)
sibsp           Number of Siblings/Spouses Aboard (ratio)
parch           Number of Parents/Children Aboard (ratio)
ticket          Ticket Number (nominal)
fare            Passenger Fare (ratio)
cabin           Cabin (nominal)
embarked        Port of Embarkation (nominal)
Data Visualization
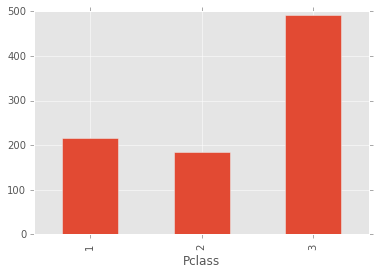
Here you can see how much people belong to each class
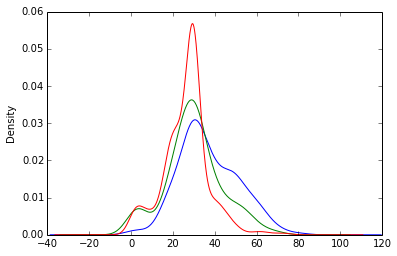
Probability density function of the age for every class
Prepare the data
When analyzing the training dataset, we can see what in every big dataset happens. Some entries are incomplete. There are several ways to deal with this data and it strongly depends on the application, which is a good way.
Examples
- Ignore the incomplete entry
- Interpolation
- Only ignore the empty value
Data enrichment
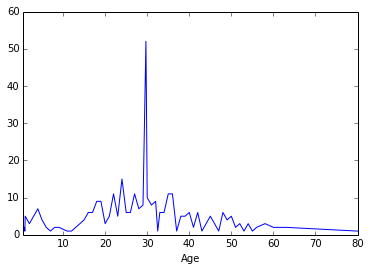
A widely used way to deal with missing data is to fill in the average of the full data set. As you see this can be dangerous, in some cases.

Part 1: Exploration
Part 2: Naive Bayes
Part 3: SVM
Part 4: Random Forest
Part 5: ANNs